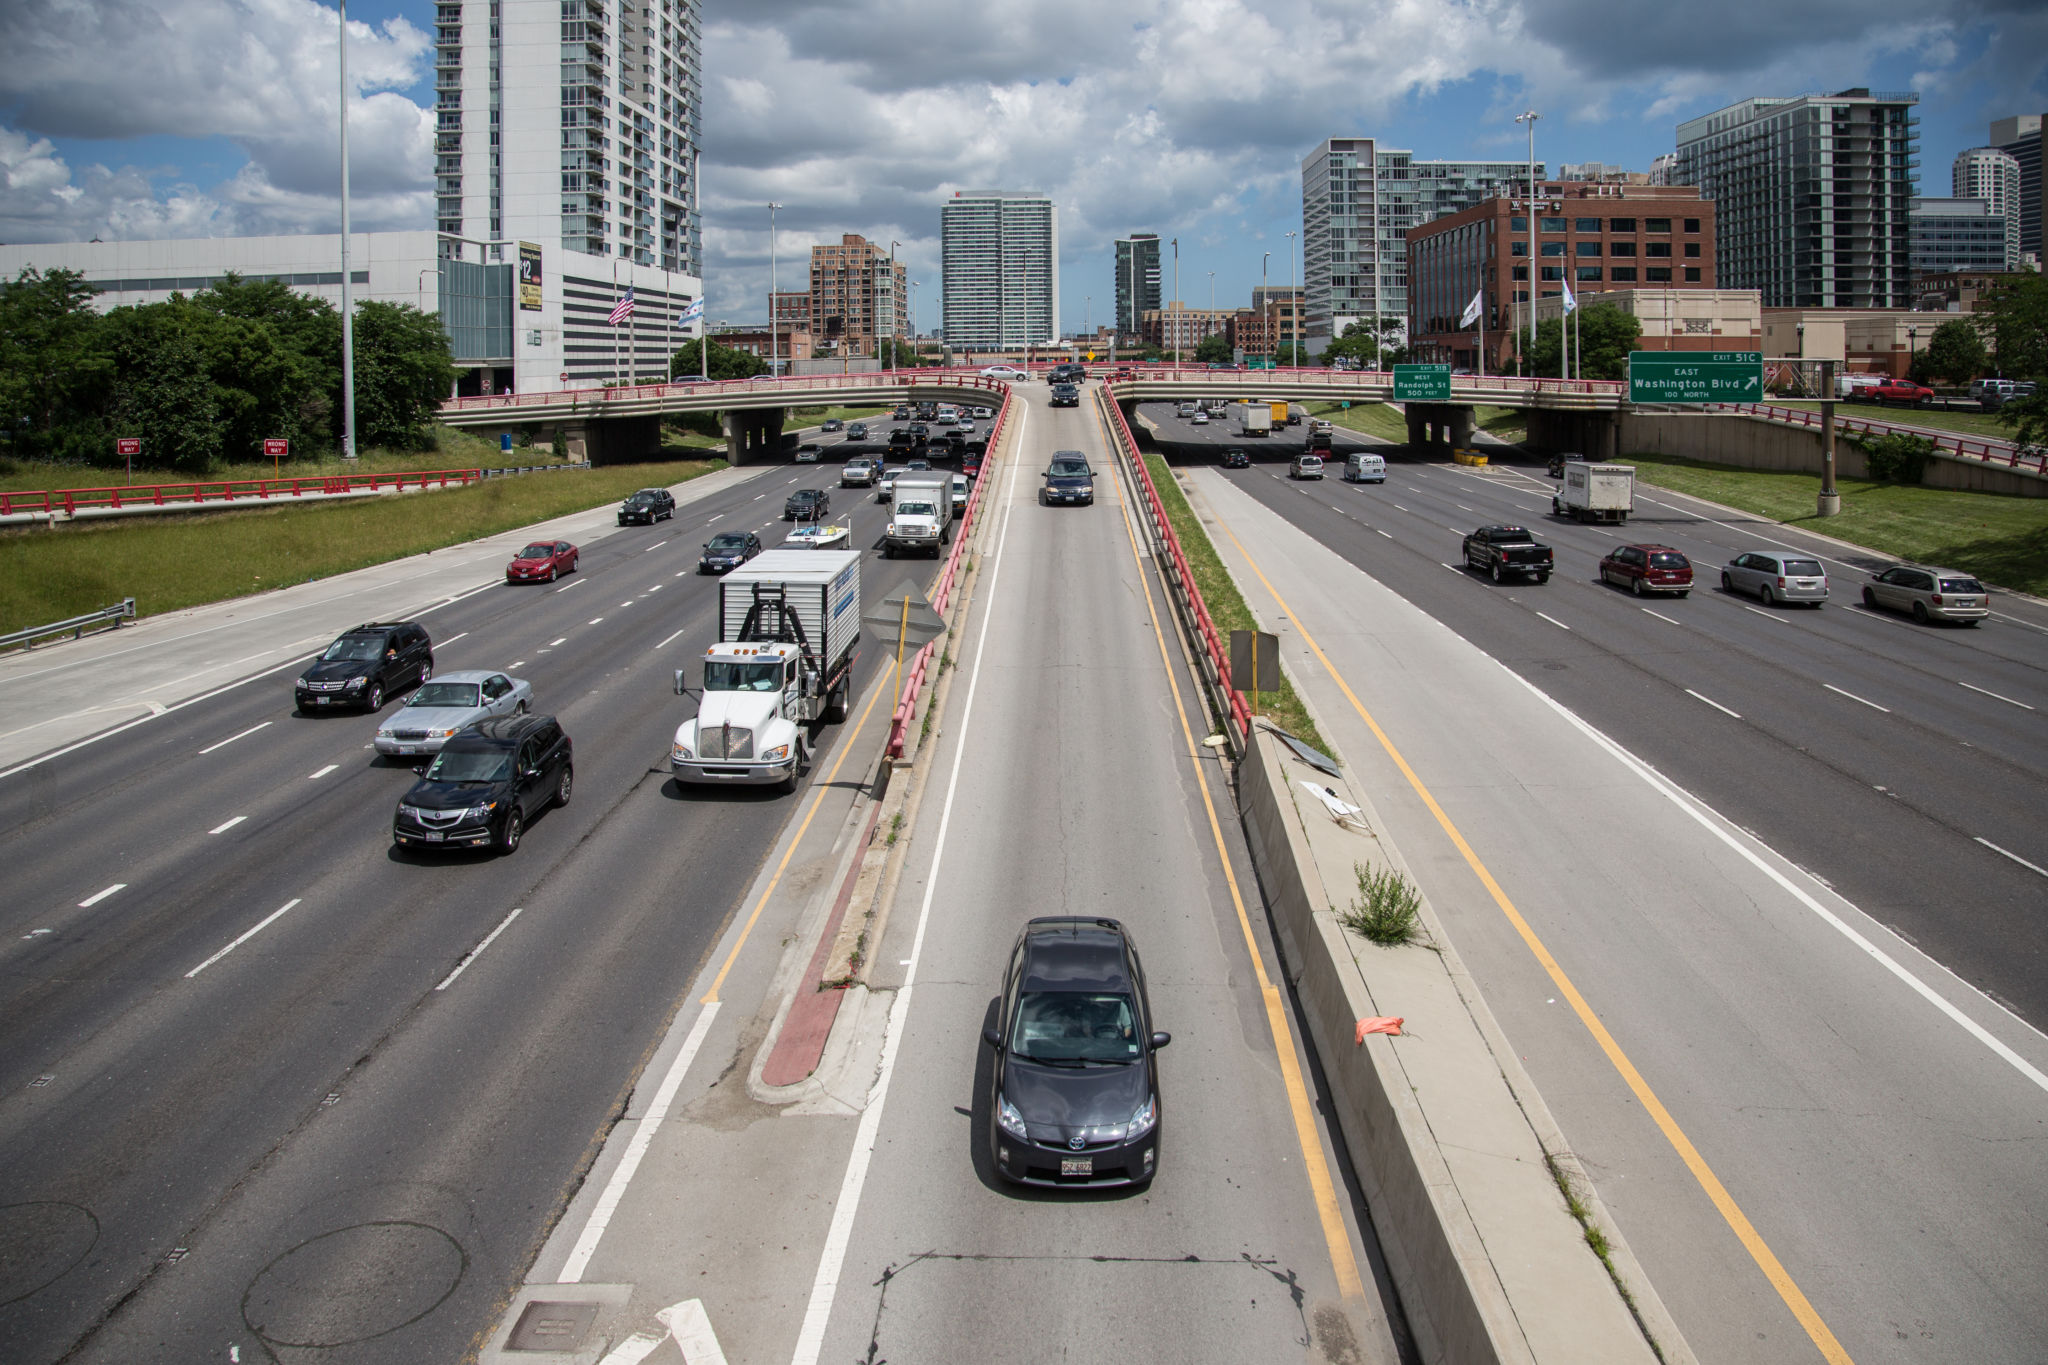
Car dependency — the concept that infrastructure and transportation planning heavily favors cars over other forms of transportation — has been a defining feature of America’s transportation systems since the construction of the interstate highway system in the post-WWII years. Zoning regulations like minimum parking requirements, the prevalence of highway infrastructure without pedestrian crossing access, the lack of bike lanes and sidewalks, and disinvestment in mass transit have all created a built environment where roughly 9 in 10 Americans rely on cars for their mobility needs, often because there is no other safe alternative for people to get where they need to go. Although cars have become the dominant mode of transportation, they’ve also become a greater household expense. As these costs continue to rise, car dependency could further exacerbate individuals’ cost of living.
Most Americans own a car, and see car ownership as effectively mandatory for upward mobility.
- Around 80 percent of drivers feel they have “no choice” but to use cars because of how their community’s transportation infrastructure is designed.
- The vast majority of American workers — 68 percent — still drive (alone) to their jobs.
- 88 percent of households use cars to shop for food, driving an average of just four miles.
- As of 2021, 91.7 percent of American households had at least one car, according to Census data, and only 8.3 percent had none.
- Car ownership plays a major role in social mobility. Having a car or a ride can factor significantly into people’s healthcare access.
- A study in 2014 of low-income families who received housing vouchers through the Department of Housing and Urban Development found that recipients who had cars fared better than those who did not.
- Cars were vital for many low-income households to be able to access more employment opportunities compared to those who had to rely on often sparse and infrequent transit.
Car dependency is a major household expenditure that hits lower-income households the hardest.
- On average, transportation is often the second-largest household expense after housing (excluding healthcare).
- U.S. households spent an average of $10,961 on transportation in 2021.
- By comparison, U.K. households spent just £3,172 (equivalent to roughly $4,200 using late 2021 exchange rates) — less than half of the average American expenditure.
- Because of the high cost of cars, people with lower incomes spend higher proportions of their budgets on transportation. Transportation can take up over a quarter of a household budget.
- Car ownership is also getting more expensive. New car prices skyrocketed by 33 percent over the last five years and a new car costs about $48,000 in May 2023 — roughly 25 percent more than one cost in May 2020.
- Used cars are also getting pricier. The price of an average used car has risen roughly 50 percent since February 2020. Prices jumped more than 4 percent between January and February 2023, the biggest increase since 2009, with the average used vehicle selling for around $26,000.
- As the upfront cost of cars rises, the costs of gas, emergency repair, maintenance, and insurance are also rising.
- Auto insurance costs increased 14 percent in 2022, with the average car owner paying about $2,000 a year for full coverage — if they have a clean driving record.
- These dynamics are mutually reinforcing: insurers have justified these higher costs due to growing costs of repairs resulting from parts and labor shortages and the increased cost of replacing vehicles, given the recent spike in used car prices.
- Rising interest rates have also made car loans far more costly: the average monthly payment for new cars reached $686 in mid-2022, and in April 2023 it hit $730. For used cars, consumers paid an average monthly payment of $551, a slight increase from the $542 they paid last year.
- This has a significant impact, since 87 percent of new cars and 34.5 percent of used cars are bought with loaned money. Nationally, auto debt reached $1.56 trillion in the first quarter of 2023.
- By comparison, monthly unlimited transit passes in cities with strong transit networks like New York, Boston, and Portland range from $90-132 per month. But few cities in the U.S. have adequate transit systems to fully replace cars as the primary mode of transportation.
- At the same time, it’s becoming harder to get a loan for a car. 14 percent of people who applied for car loans in June 2023 were denied.
- Exacerbating the issue, the auto market is trending towards more expensive cars. In 2017, there were 11 models available on the U.S. market for less than $20,000. By the end of 2022, there were four, and by March 2023, only two.
- As a result, fewer people are buying new vehicles in the United States than they did before the pandemic — about 13.9 million in 2022, versus 17 million in 2019.
- On top of these high costs, cars are an investment that rapidly depreciate in value. Cars lose 20 percent of their value in the first year and 15 percent every year thereafter.
- 44 percent of all traded-in vehicles in 2020 were carrying negative equity, meaning that borrowers still owed their lenders more than their vehicles were worth. Most roll that debt over into a new loan.
Drivers of color also face systemic racism and discrimination in the auto market.
- Because of the rising cost trends, more people are effectively being priced out of the market. Spending on new cars by the bottom 20 percent of earners dropped to its lowest level in 11 years.
- Communities of color tend to be burdened with higher costs compared to white communities with similar risks and accident costs. As a result, car insurance can cost 30 percent more for people living in majority-minority zip codes compared to white ones with similar risk profiles.
- Black and Hispanic applicants are also more likely to be denied car loans than white people with the same credit scores and incomes, and pay higher interest rates when they’re approved.
- Lenders are especially predatory to people with low credit scores and can trap them further in debt.
- Purchasing terms are also regressive, meaning poorer people often pay higher rates. For used car buyers with subprime scores, the average interest rate is at 17 percent, up about 4 points over the past year, and those with below subprime credit have to pay an average rate of 22 percent.
- One survey found that expensive monthly car payments and rising insurance costs are two factors that pushed 35 percent of respondents to say that they are planning to go carless by the end of the decade.
A combination of mass transit, micromobility, electric vehicles, and smart development policy can reduce car dependency and lower the costs of transportation.
- Electric vehicles (EVs) can reduce some of the costs of car ownership, saving owners money on fueling and maintenance costs compared to equivalent gas-powered cars.
- Households with better access to mass transit drive less on average, and can save up to $10,000 annually by taking public transit and owning one less car.
- Some cities — particularly those transit agencies that don’t rely on fares for large portions of their funding — are also making their transit systems fare-free, making transit universally accessible at no cost.
- Microtransit programs can also help meet rural communities’ transportation needs — and advance mobility for people unable to drive.
- In some cities, commuters are ditching cars altogether in favor of affordable e-bikes. On average, e-bikes replaced 3.4 car trips per week among Denver residents.
- Demand for e-bikes is booming. There were more e-bikes sold in 2021 than electric cars, while Connecticut’s e-bike voucher program sold out in three days.
- Urban planning and design is one of the most powerful tools for equitably reducing car dependency. This can include zoning that promotes denser development, cuts parking requirements, improves pedestrian infrastructure.
- By designing communities for multimodal access (e.g. walking, biking, transit, rail, rideshares, etc.), cities and their urban planners can ensure residents have more — and more affordable — ways to get around.