On Oct. 8, the Intergovernmental Panel on Climate Change (IPCC) released the much anticipated Special Report on 1.5°C in Incheon, South Korea.
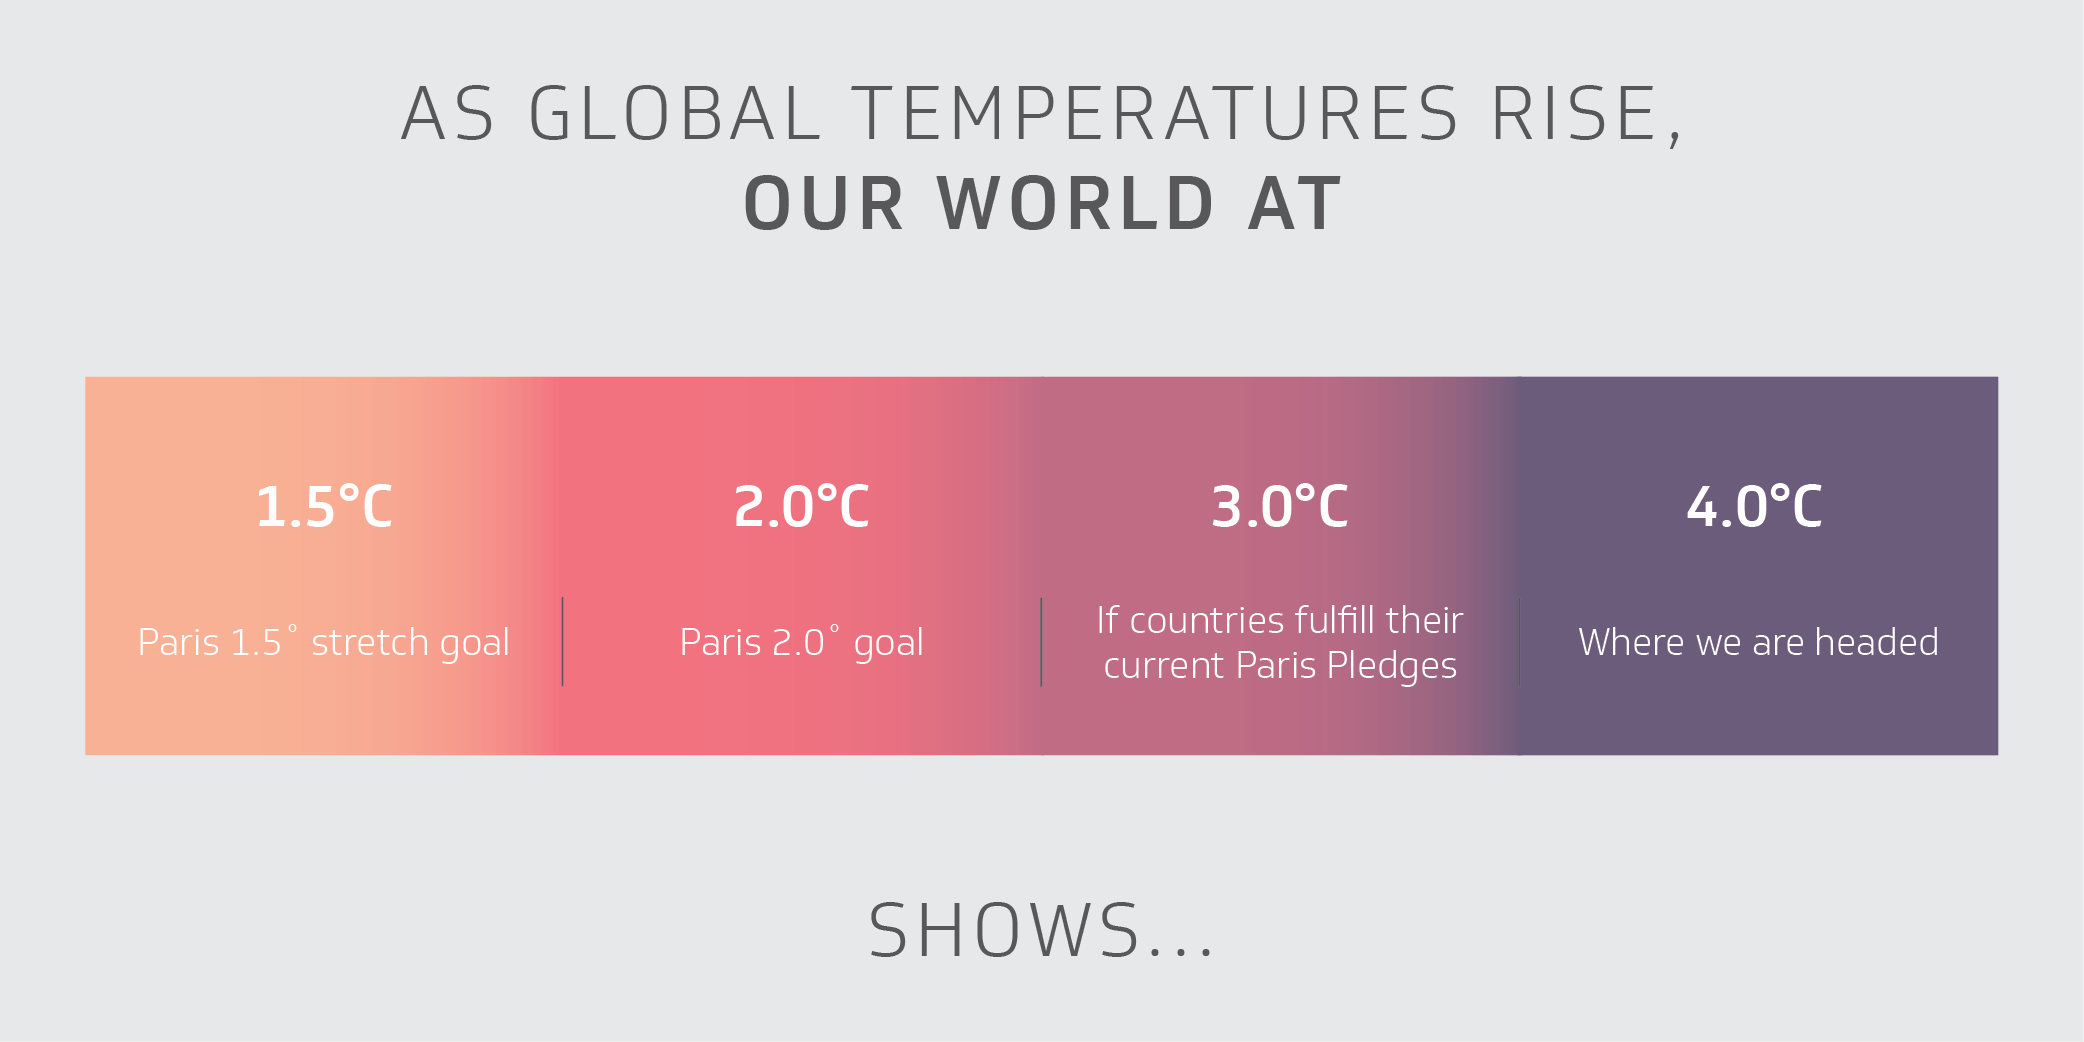
The report shows that climate change has already caused global temperatures to rise about 1°C above pre-industrial levels. Unless emissions are rapidly reduced, temperatures could rise 1.5°C by 2040, 2°C by 2065 and 4°C by 2100.
It’s hard to be certain what this level of temperature rise will mean for the world’s natural systems, economy and human society. In the past, it has taken thousands of years for temperature to rise by a few degrees, and big changes are already occurring as a result of a 1°C increase. Scientists say that the impacts will be much worse at even 2°C than previously projected. That means 2°C, let alone 3°C or 4°C, is no longer a safe goal to avoid the worst impacts of climate change. We can avoid much, but not all, of the loss and risk of climate change by limiting warming to 1.5°C.
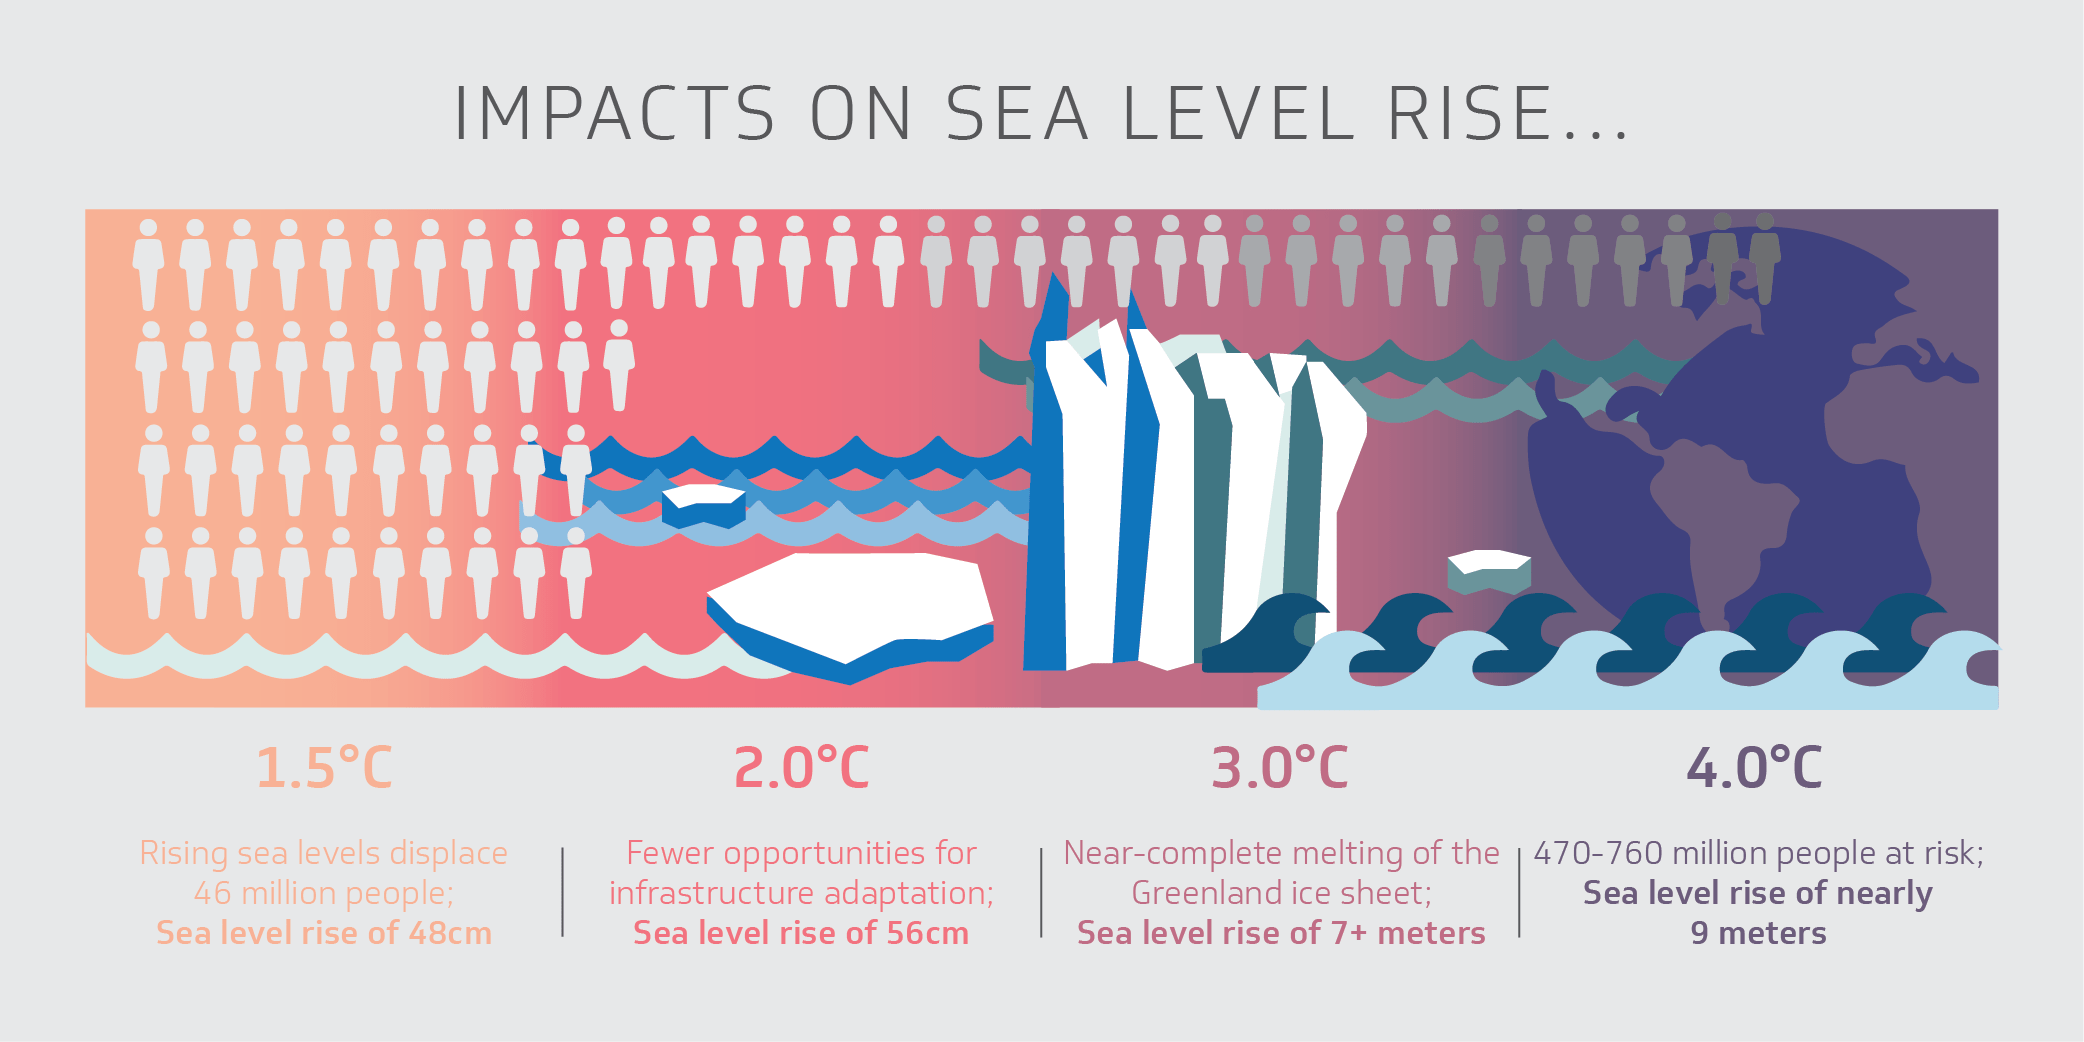
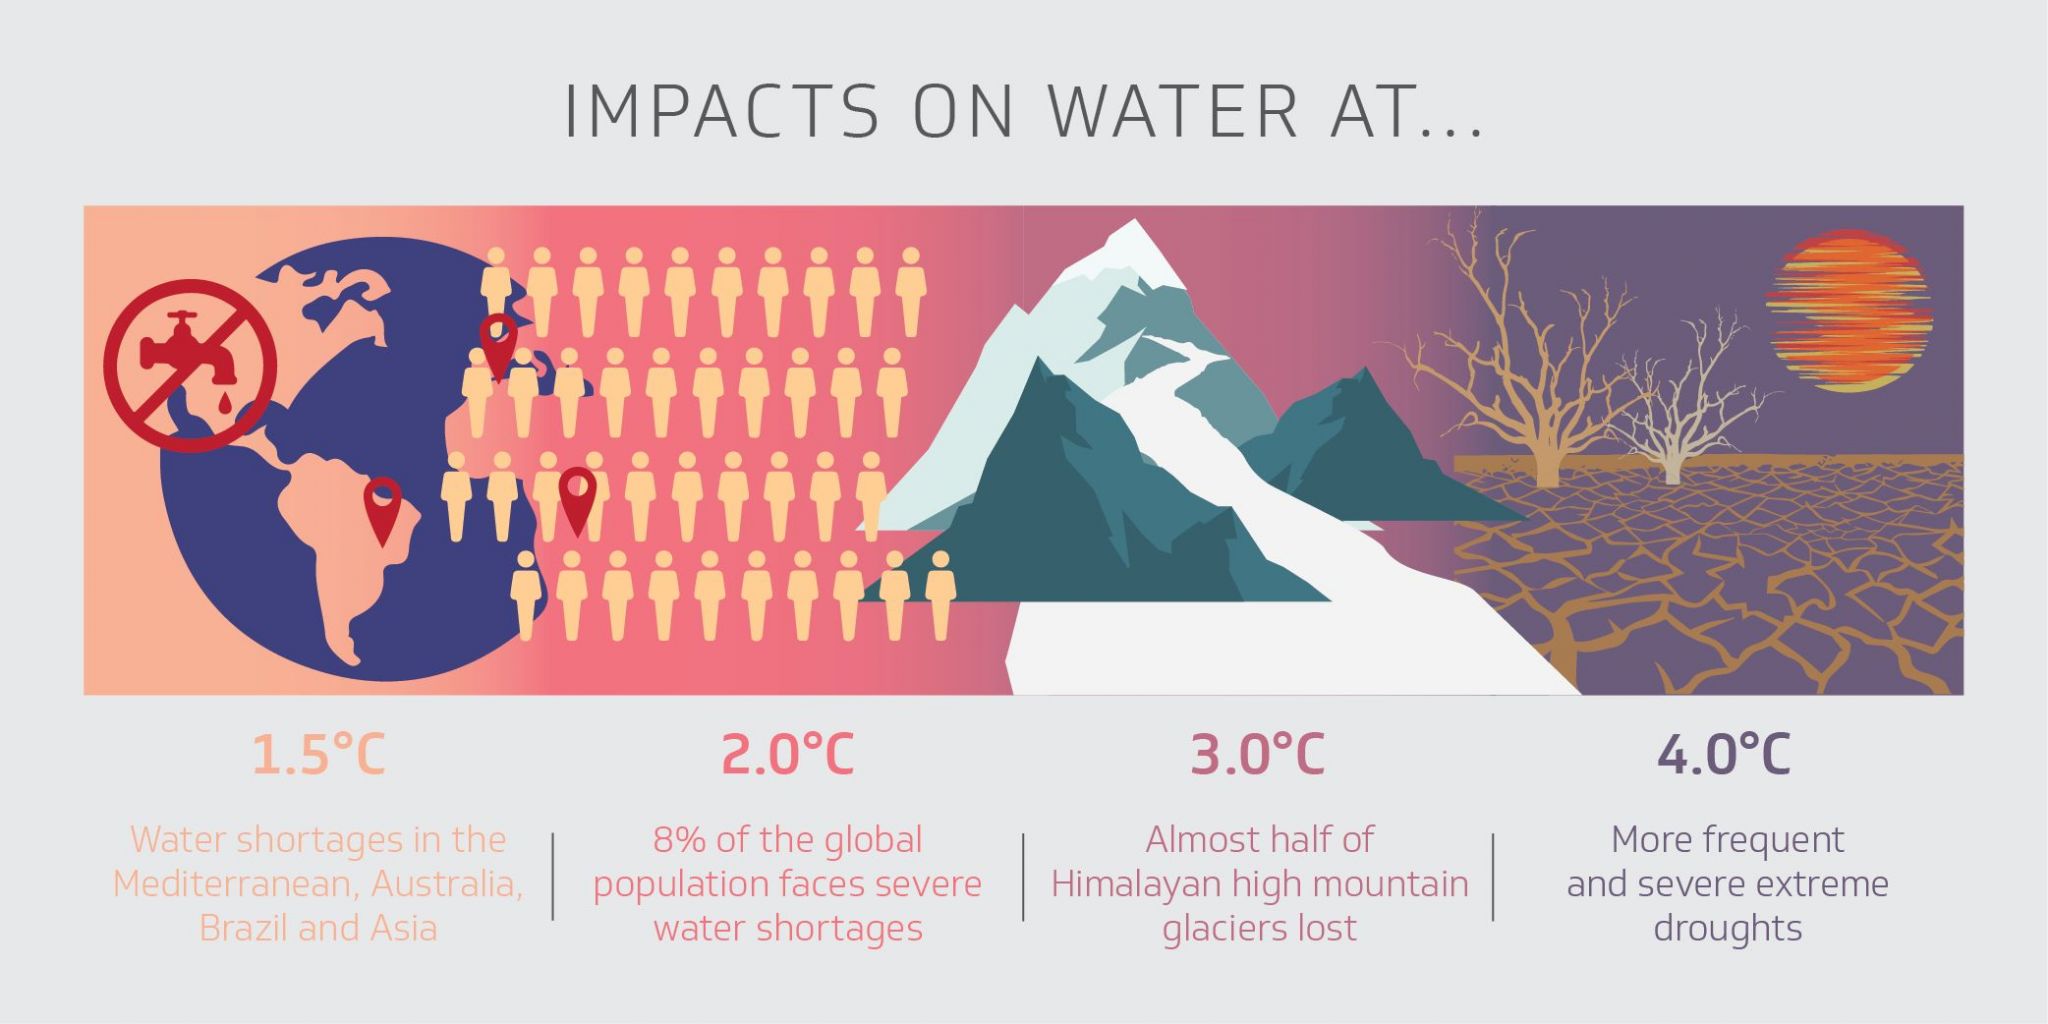
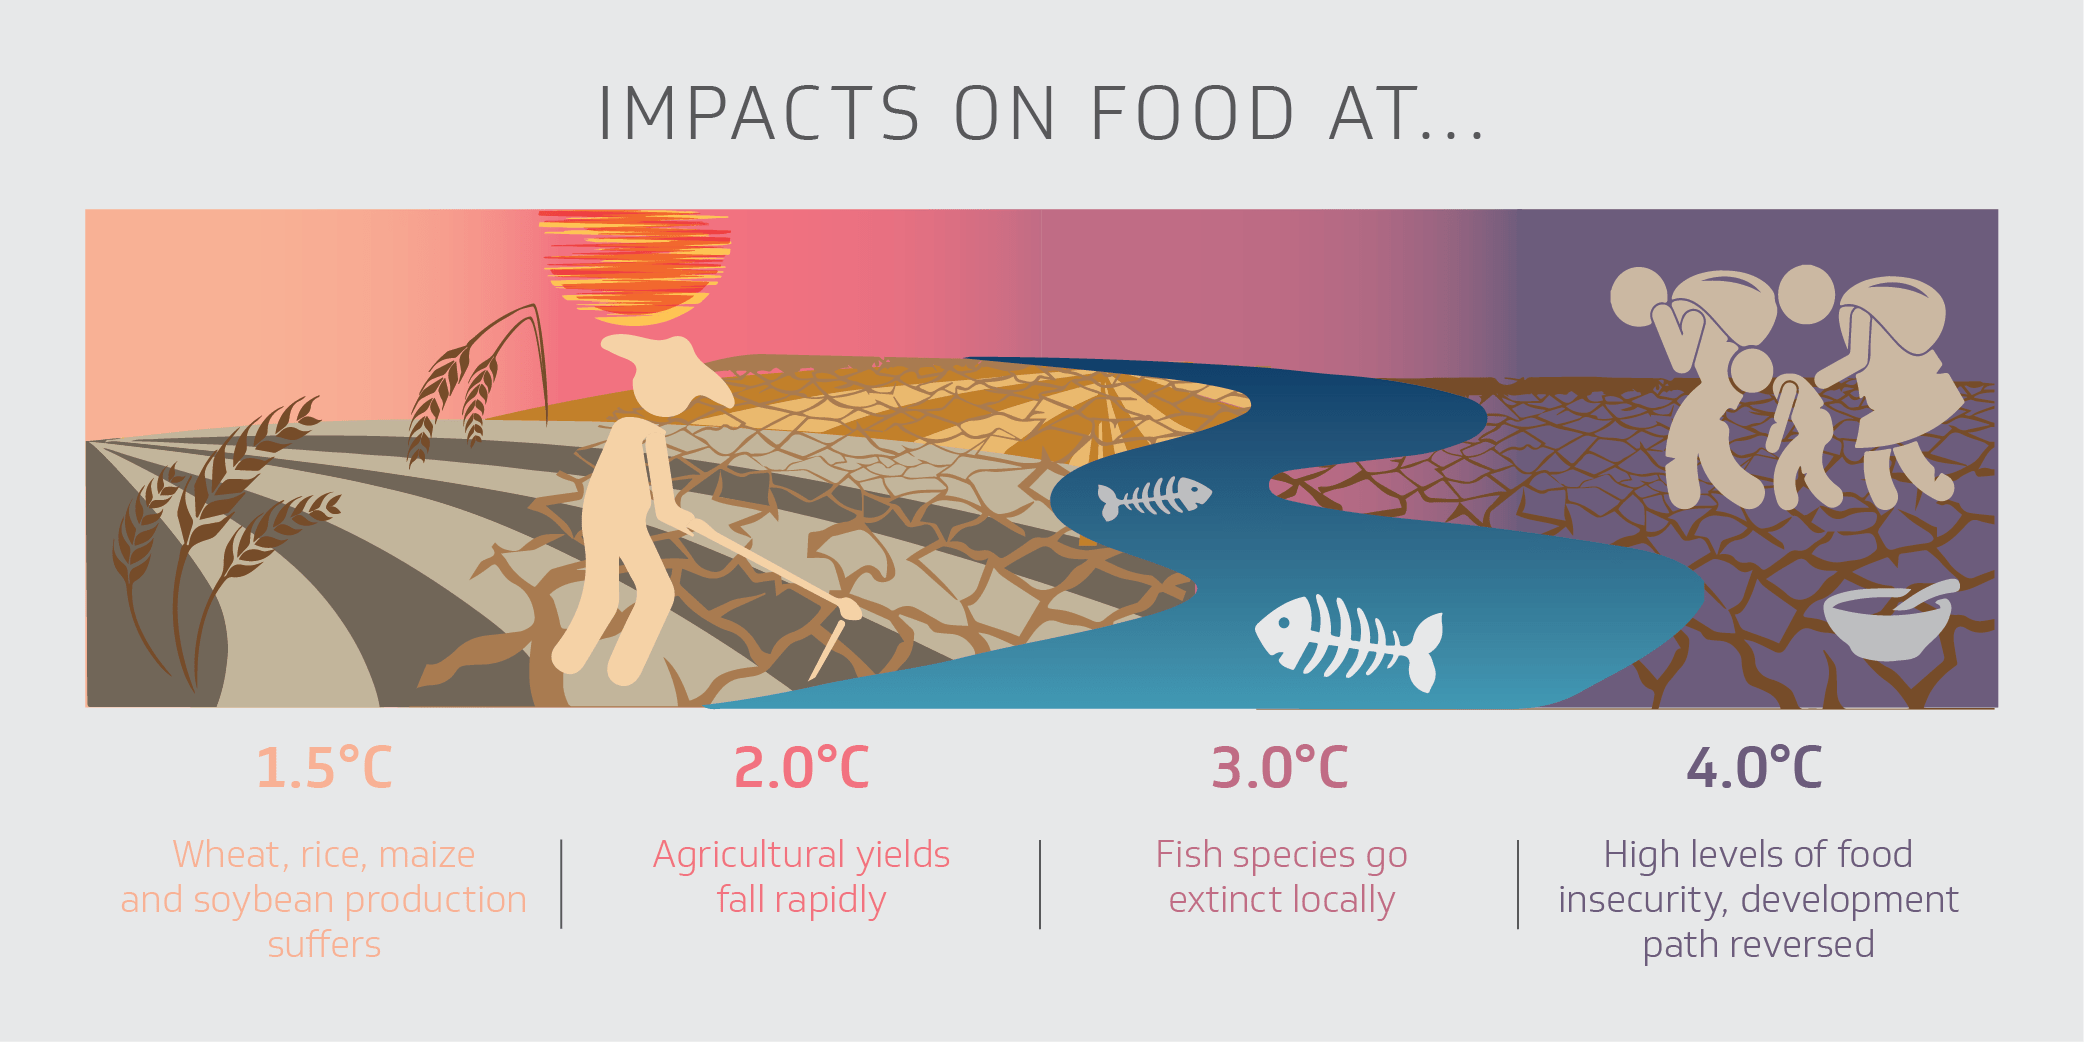
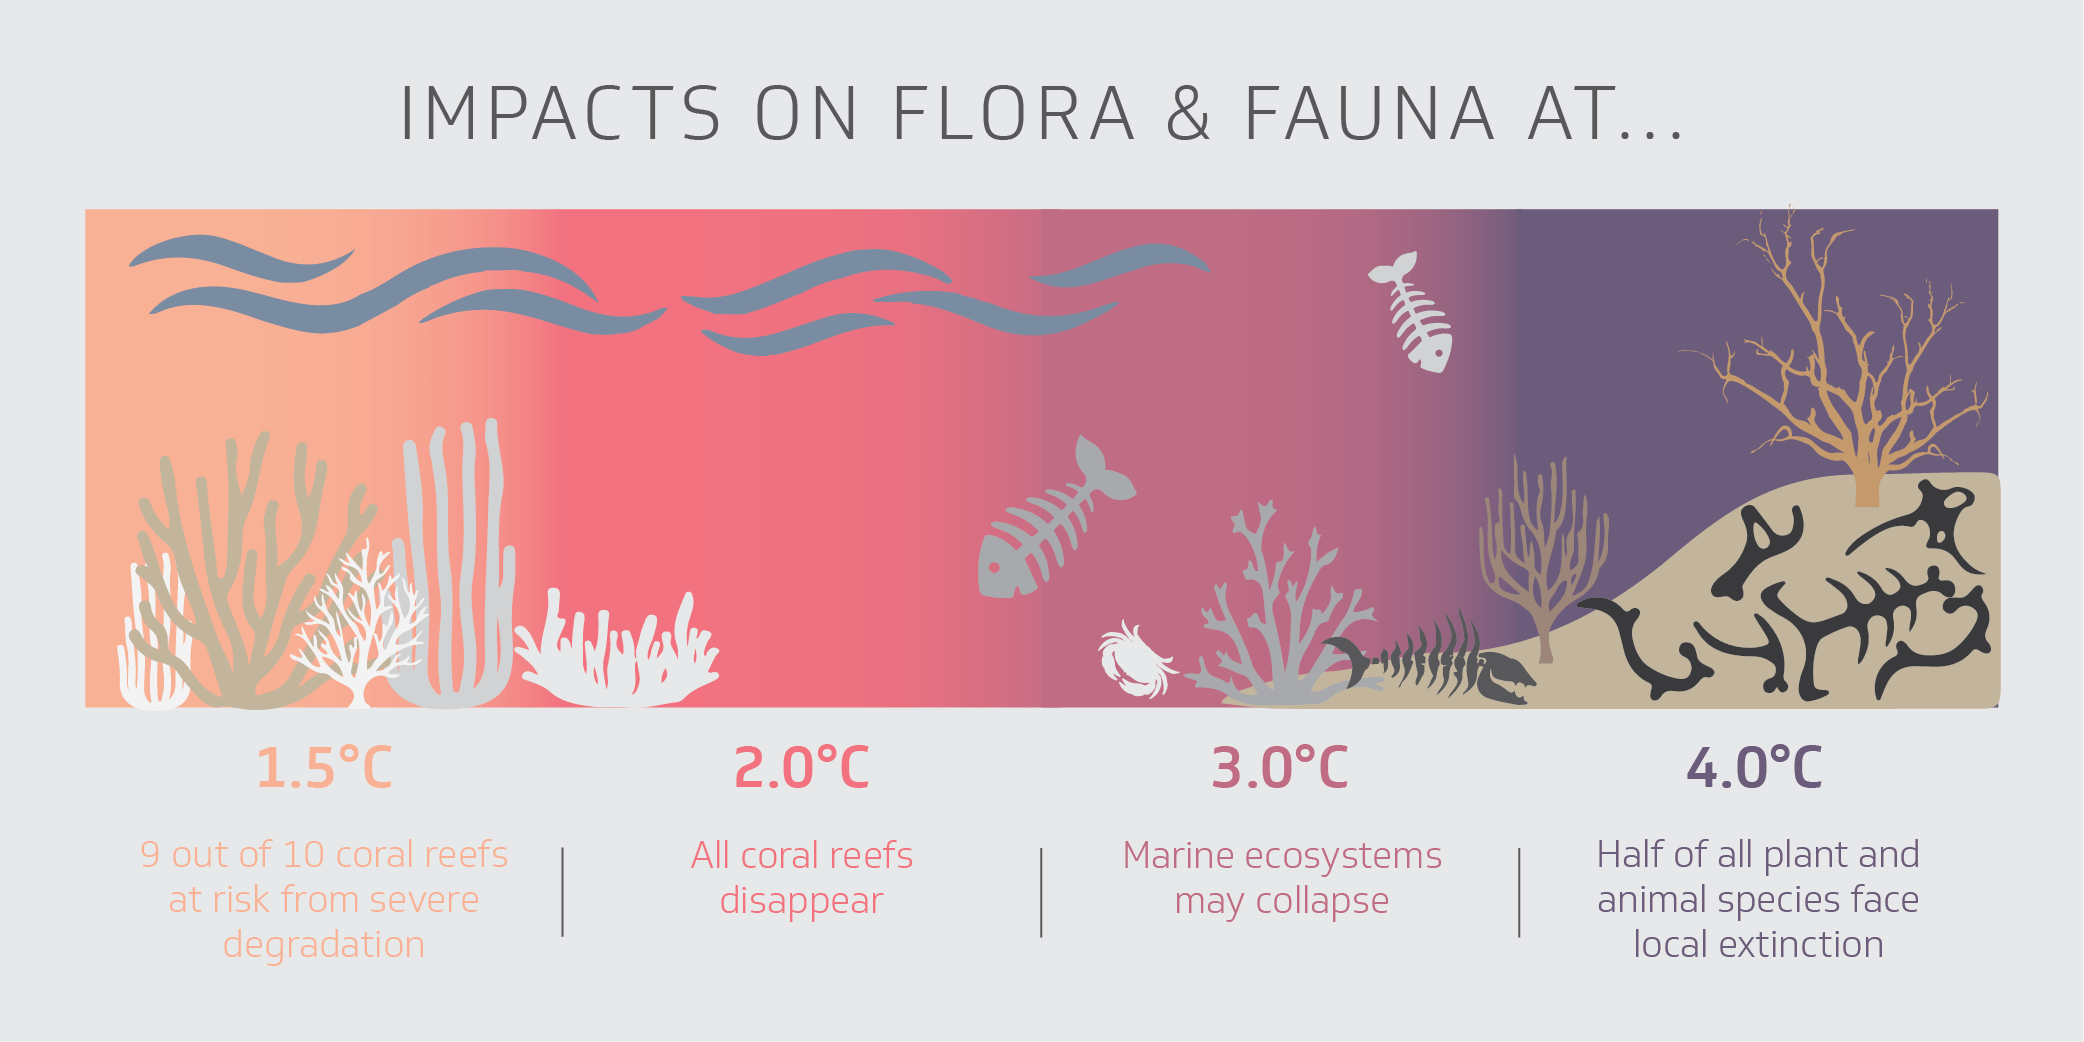
Below are a set of graphics that show visually what the impacts will most likely be at temperature scenarios of 1.5°C, 2°C, 3°C and 4°C.
To read our backgrounder on the IPCC Special Report on 1.5°C, click here.
To read our experts’ reactions to the IPCC Special Report on 1.5°C, click here.

