This Thursday, September 17, the National Oceanic and Atmospheric Administration (NOAA) will likely confirm other sources’ finding that August 2015 was the hottest August in the global temperature record by a wide margin. NOAA will also likely confirm that this year’s June, July, and August comprised the hottest June-August period in the global record. Earlier this year, the March-May period of 2015 was the hottest spring quarter on record in the Northern Hemisphere.
Many scientists who track global temperatures say that 2015 is all but guaranteed to be the hottest year on record, exceeding last year’s record-breaking temperature (1).
The record heat from June through August fueled a summer of extremes in the Northern Hemisphere, and the trend is likely to continue as the 2015 El Niño gets stronger towards the new year (2).
Why is 2015 so hot?
El Niño + global warming = record high temperatures
Heat circulation
“[Record global heat] is yet another reminder that global warming continues apace. Climate change is no longer a challenge facing future generations: we are experiencing its impacts today. Not only that, but we will continue to see these records being broken, year after year, until we are able to wean ourselves off our addiction to dirty, old-fashioned fossil fuels.”
Accumulated CO₂ and other greenhouse gases in the atmosphere are steadily trapping more and more heat on Earth. As the Earth heats up, the added heat energy circulates through the air, land and ocean, driven by long-standing climate patterns. Over 90 percent of the additional heat enters the ocean, with a large percentage of heat ending up in the deep ocean (3,4). As a result, the oceans have been warming steadily and rapidly with no slowdown. During some climate events, such as La Niña, additional heat gets buried. In a La Niña period, the full impact of global warming is hidden, until that heat is released back into the atmosphere during circulation processes like El Niño. Consequently, the warming of global surface temperatures due to climate change is uneven, slowing down in some years as more heat is buried in the oceans and accelerating sharply in other years—such as El Niño years—when surface temperatures spike.
ENSO
The El Niño Southern Oscillation (ENSO) has important implications for surface temperature observations. During the positive phase of ENSO (commonly known as El Niño) some of the added heat that gets stored in the ocean spreads out and is released back into the atmosphere, causing large-scale atmospheric circulation changes and an increase in global temperature. The combined effects of this phenomenon and human-caused warming are fueling 2015’s record heat.
El Niño and record heat
Scientists predicted the possibility of back-to-back record heat years soon after 2014 became the hottest year on record, due to the likely emergence of an El Niño event that would boost global temperature even further (5).
Prior to 2014, which had some but not all the characteristics necessary to declare an official El Niño event (6), two El Niño years—2010 and 2005—were tied for the hottest year on record. Scientists predicted that the emergence of a strong El Niño event in 2015 would very likely lead to another record-warm year, because records are traditionally broken when natural variation and human-caused warming run in the same direction.
NOAA officially declared El Niño’s arrival on March 5 of this year, and by September 2015, it already ranked as the second to third strongest ENSO on record (7,8). The 2015 event will likely peak in the fall and last through the winter, with a chance that it could even become the strongest on record. Satellite observations and computer models from NOAA’s September El Niño report point to sea surface warming in the Pacific Ocean that is on par with conditions seen in 1982-83 and 1997-98—the two strongest El Niño events on record (9).
2015 record heat
June, July and August—the three hottest months of the year globally—each set new temperature records for their months, with NOAA’s official announcement for August expected on Thursday, September 17 (10,11). July’s monthly average was the highest on record for any month since 1880 when records began (12). Also this year, February, March and May broke their monthly temperature records. The remaining months of 2015, January and April, were not far behind. January 2015 was the second warmest January on record and April 2015 was, the third warmest April.
In sum, six of the first eight months of 2015 were the warmest of their months in history, due to the combination of El Niño and human-caused warming. As a result, it is all but certain that 2015 will beat out 2014 as the hottest year on record. Additionally, depending on how fast the El Niño event dissipates, 2016 could be even hotter (13).
Record global temperature linked to extreme summer events
“I would expect that we could break the [hottest year] record by close to 0.1°C. That’s the range we’re in now. It’s higher than we typically see when we break a record, where we see a hundredth or two-hundredths of a degree. So this is quite a large margin.”
One of the clearest findings of climate science is that global warming amplifies the intensity, duration and frequency of extreme heat events. Even a small-seeming change in average global temperature—1.3°F (0.72°C) since 1951—can lead to dramatic regional changes in extreme events. Due to global warming, extreme heat events impact a percentage of the globe 10 times greater than they did from 1951-1980 (14). Here is a list of extreme heat events that occurred during the hottest summer on record:
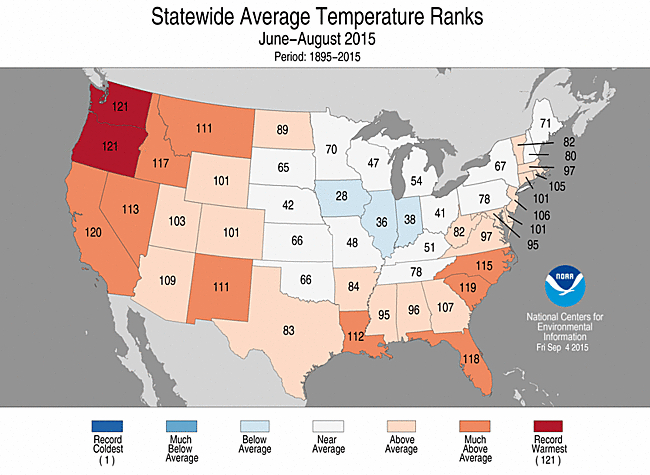
United States: Eleven states across the West and Southeast were much warmer than average. Oregon and Washington each had their warmest summer on record. Oregon’s summer temperature was 4.6°F (2.6°C) above average, besting the previous record set in 2003 by 0.6°F. Washington’s summer temperature was 5.3°F (2.9°C) above average, beating the previous record set in 1958 by 1.1°F (0.6°C) (15).
India: A searing heat wave killed more than 2,300 people at the end of May, making it the 5th deadliest in recorded world history (16,17).
Pakistan: In June, Pakistan suffered its deadliest heat wave ever, with the death toll reaching 1,213. It was the eighth deadliest heat wave on record globally (18,19). The heat index peaked at 121˚F (49.4°C).
Europe: A heat wave brought record temperatures across Europe at the beginning of July, during which time Germany hit an all-time high of 104.5°F (40.3°C) (20).
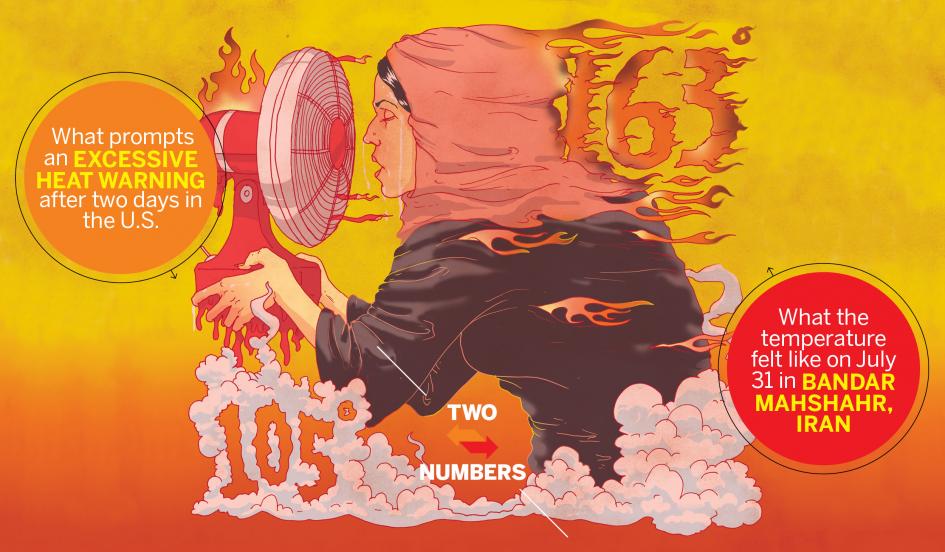
Middle East: At the end of July, the temperature in Iran reached 115°F (46.1°C) with a dew point of 90°F (32.2°C), creating a “real feel” temperature of 163°F (72.8°C) (21). Baghdad set a new all-time high temperature record of 124°F (51.1°C). In August, heat waves in the Middle East brought high temperatures and soaring humidity, nearing and breaking meteorological records across the region (22).
Extreme precipitation and flooding
In the past half-century, climate change has charged the atmosphere with more water vapor, fueling extreme precipitation and loading storms of all types with additional moisture that ends up as rain and snowfall (23). The fingerprint of global warming has been firmly documented in the shift toward extreme precipitation already observed in the northern hemisphere (24).A study finds a 12 percent increase in heavy events in recent decades across the globe, and a 56 percent increase in South East Asia (25). Even areas that see less precipitation overall, like the southwestern United States, have experienced this trend of more intense precipitation events (26). Here is a list of extreme precipitation events that occurred during the hottest summer on record:
United States: In May, Oklahoma and Texas had their wettest month of any month on record, with widespread flooding across the region (27). A study found that global warming intensified the floods (28).
Myanmar: Torrential rains that began in June triggered floods and landslides across central and western Myanmar, killing more than 100 people and affecting 1.3 million (29).
United States: California received more rain over a single weekend in July than it did during the entire month of January—the state’s rainiest month (30).
Japan: In early September, record-breaking rain of over 23.6in (600mm) burst the banks of two rivers in two days, causing massive flooding and three deaths (31).